I develop infographics to transform complex concepts and datasets into compelling visual narratives. The following graphics have supported media outreach, legislative testimony, and community engagement efforts. I led each project from identifying key takeaways to visual concepting and design, ensuring that every piece aligned with our organizational goals.
Elections Administration
Elections in Rhode Island are administered by two distinct state entities and the local cities and towns. I developed the concept of this infographic to delineate the specific functions of each entity involved. This helped local media professionals understand who to call with specific inquiries.

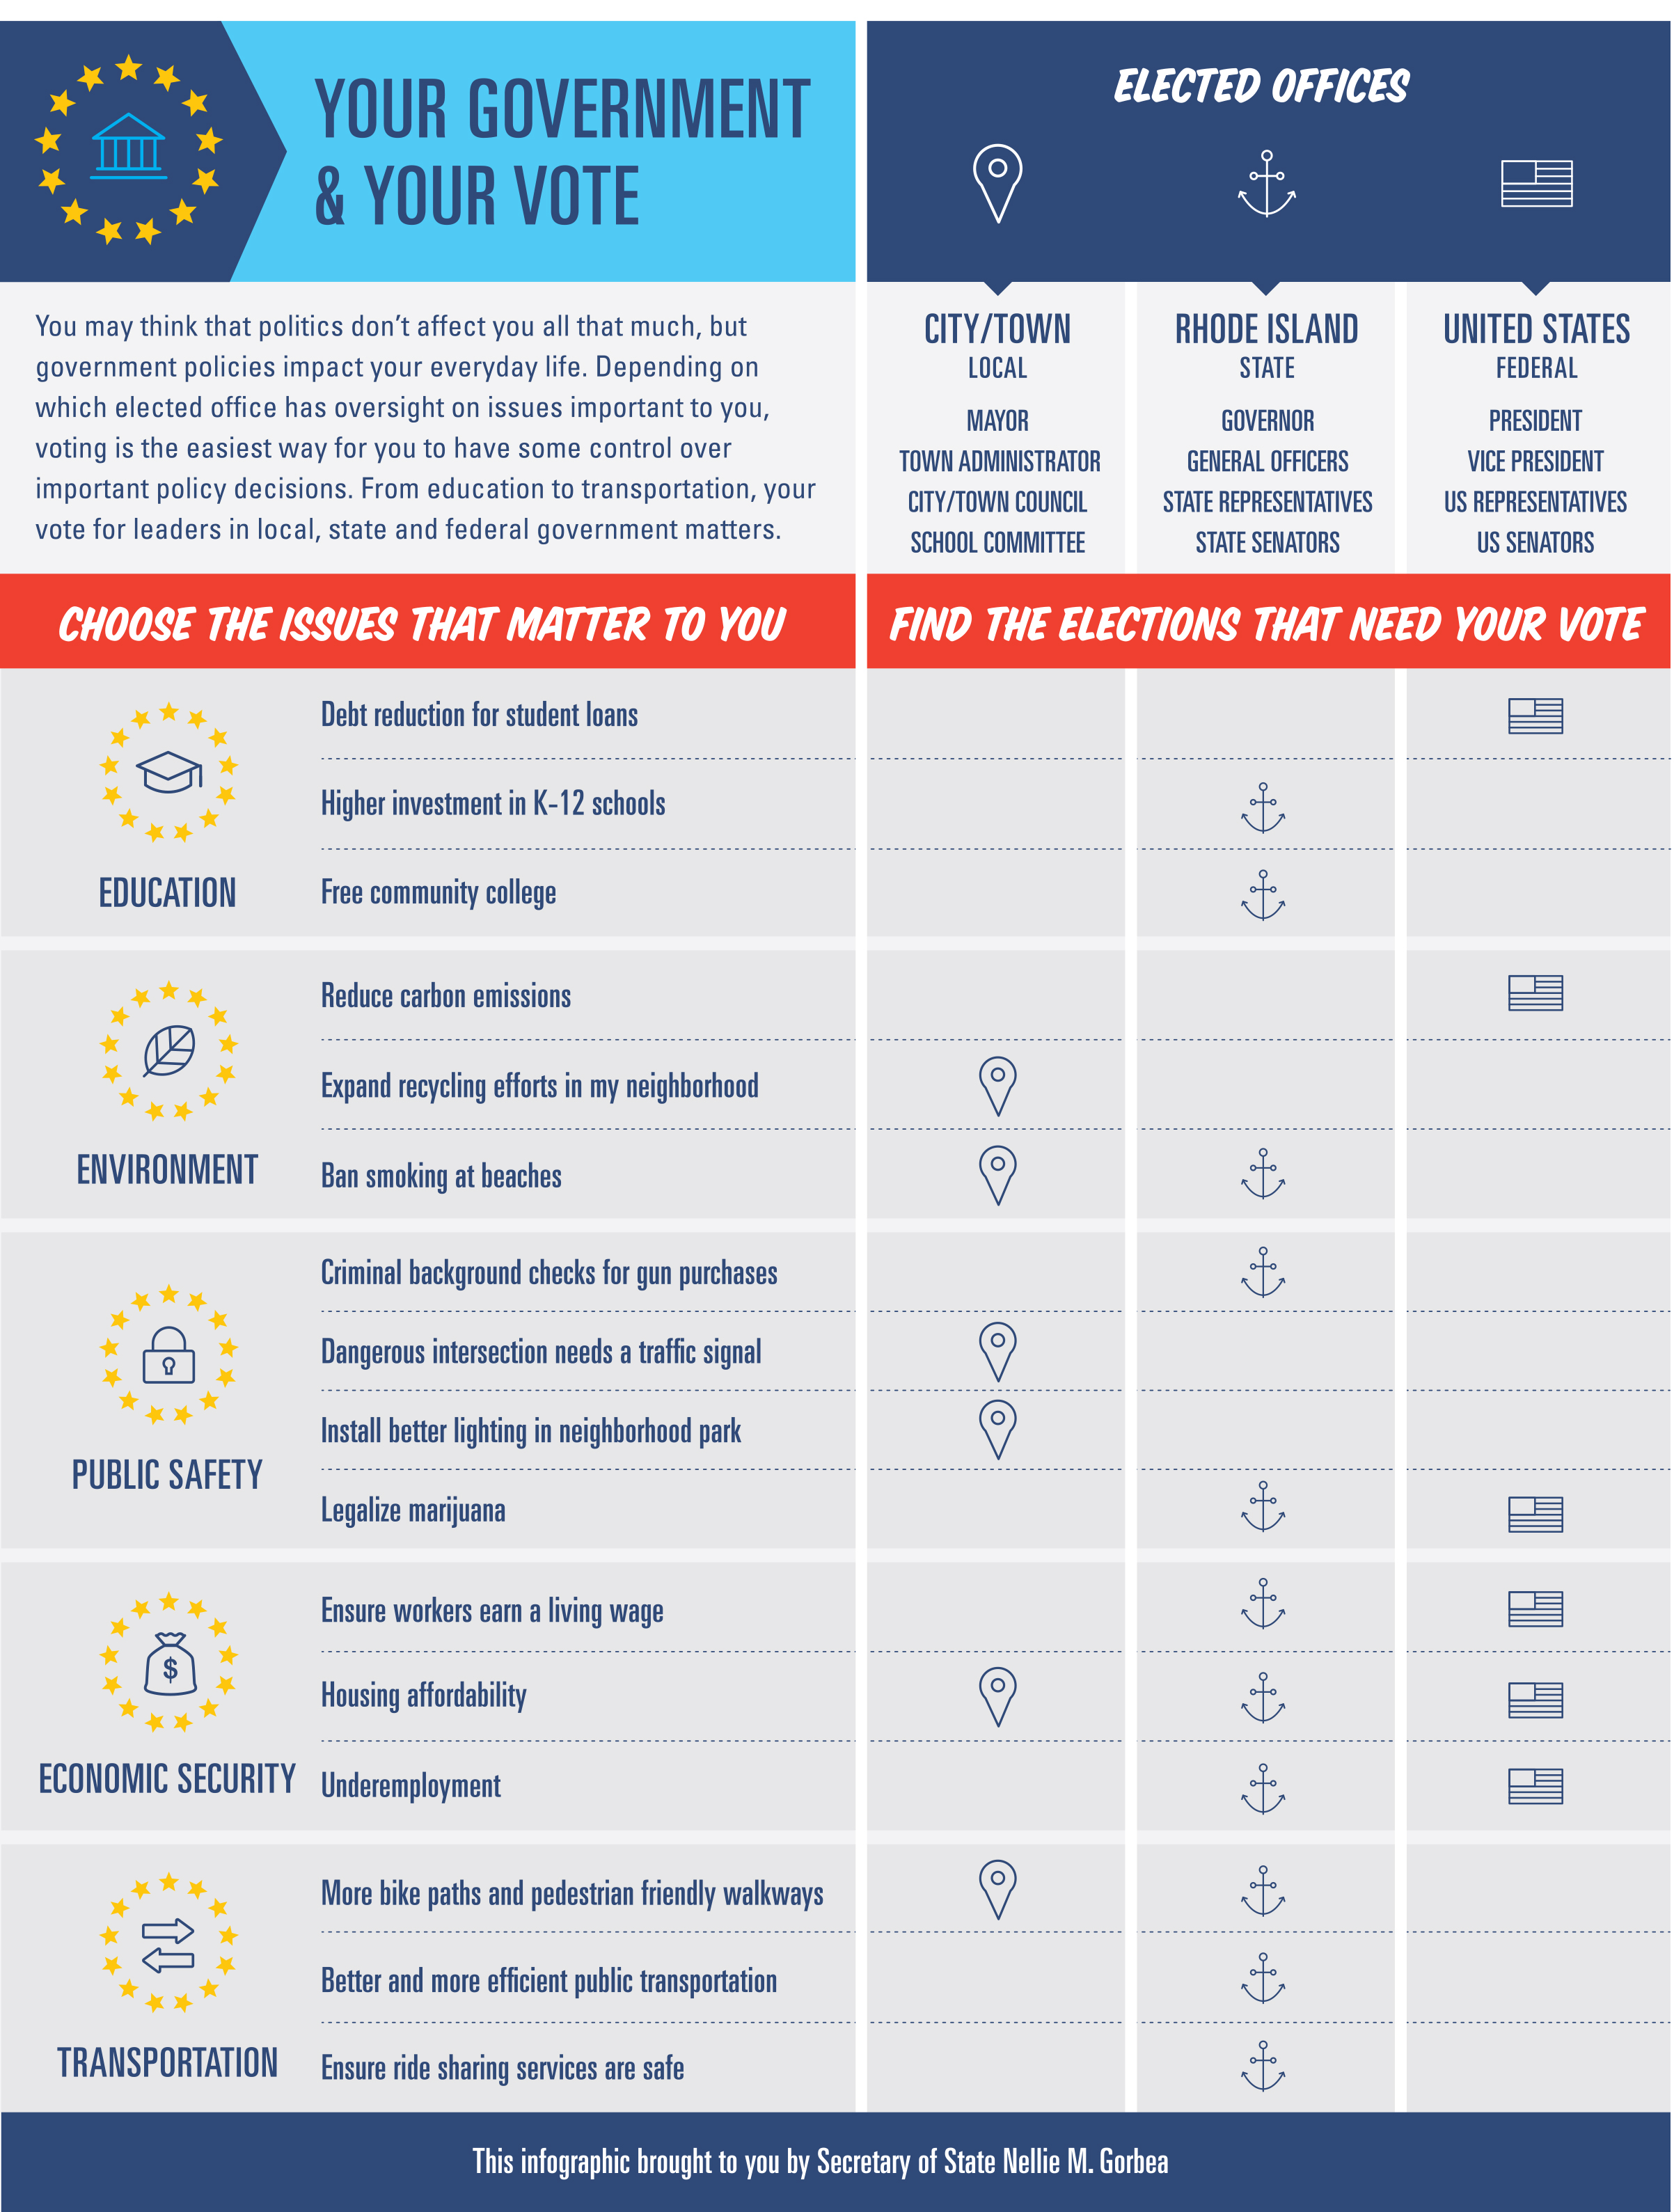
Levels of Government
In an effort to highlight the importance of voting in every election, I developed this infographic concept to connect issues with elections. The infographic reinforced to young voters especially that elected officials at all levels of government are making decisions about issues they care about. This infographic has a complementary “levels of government” animation.
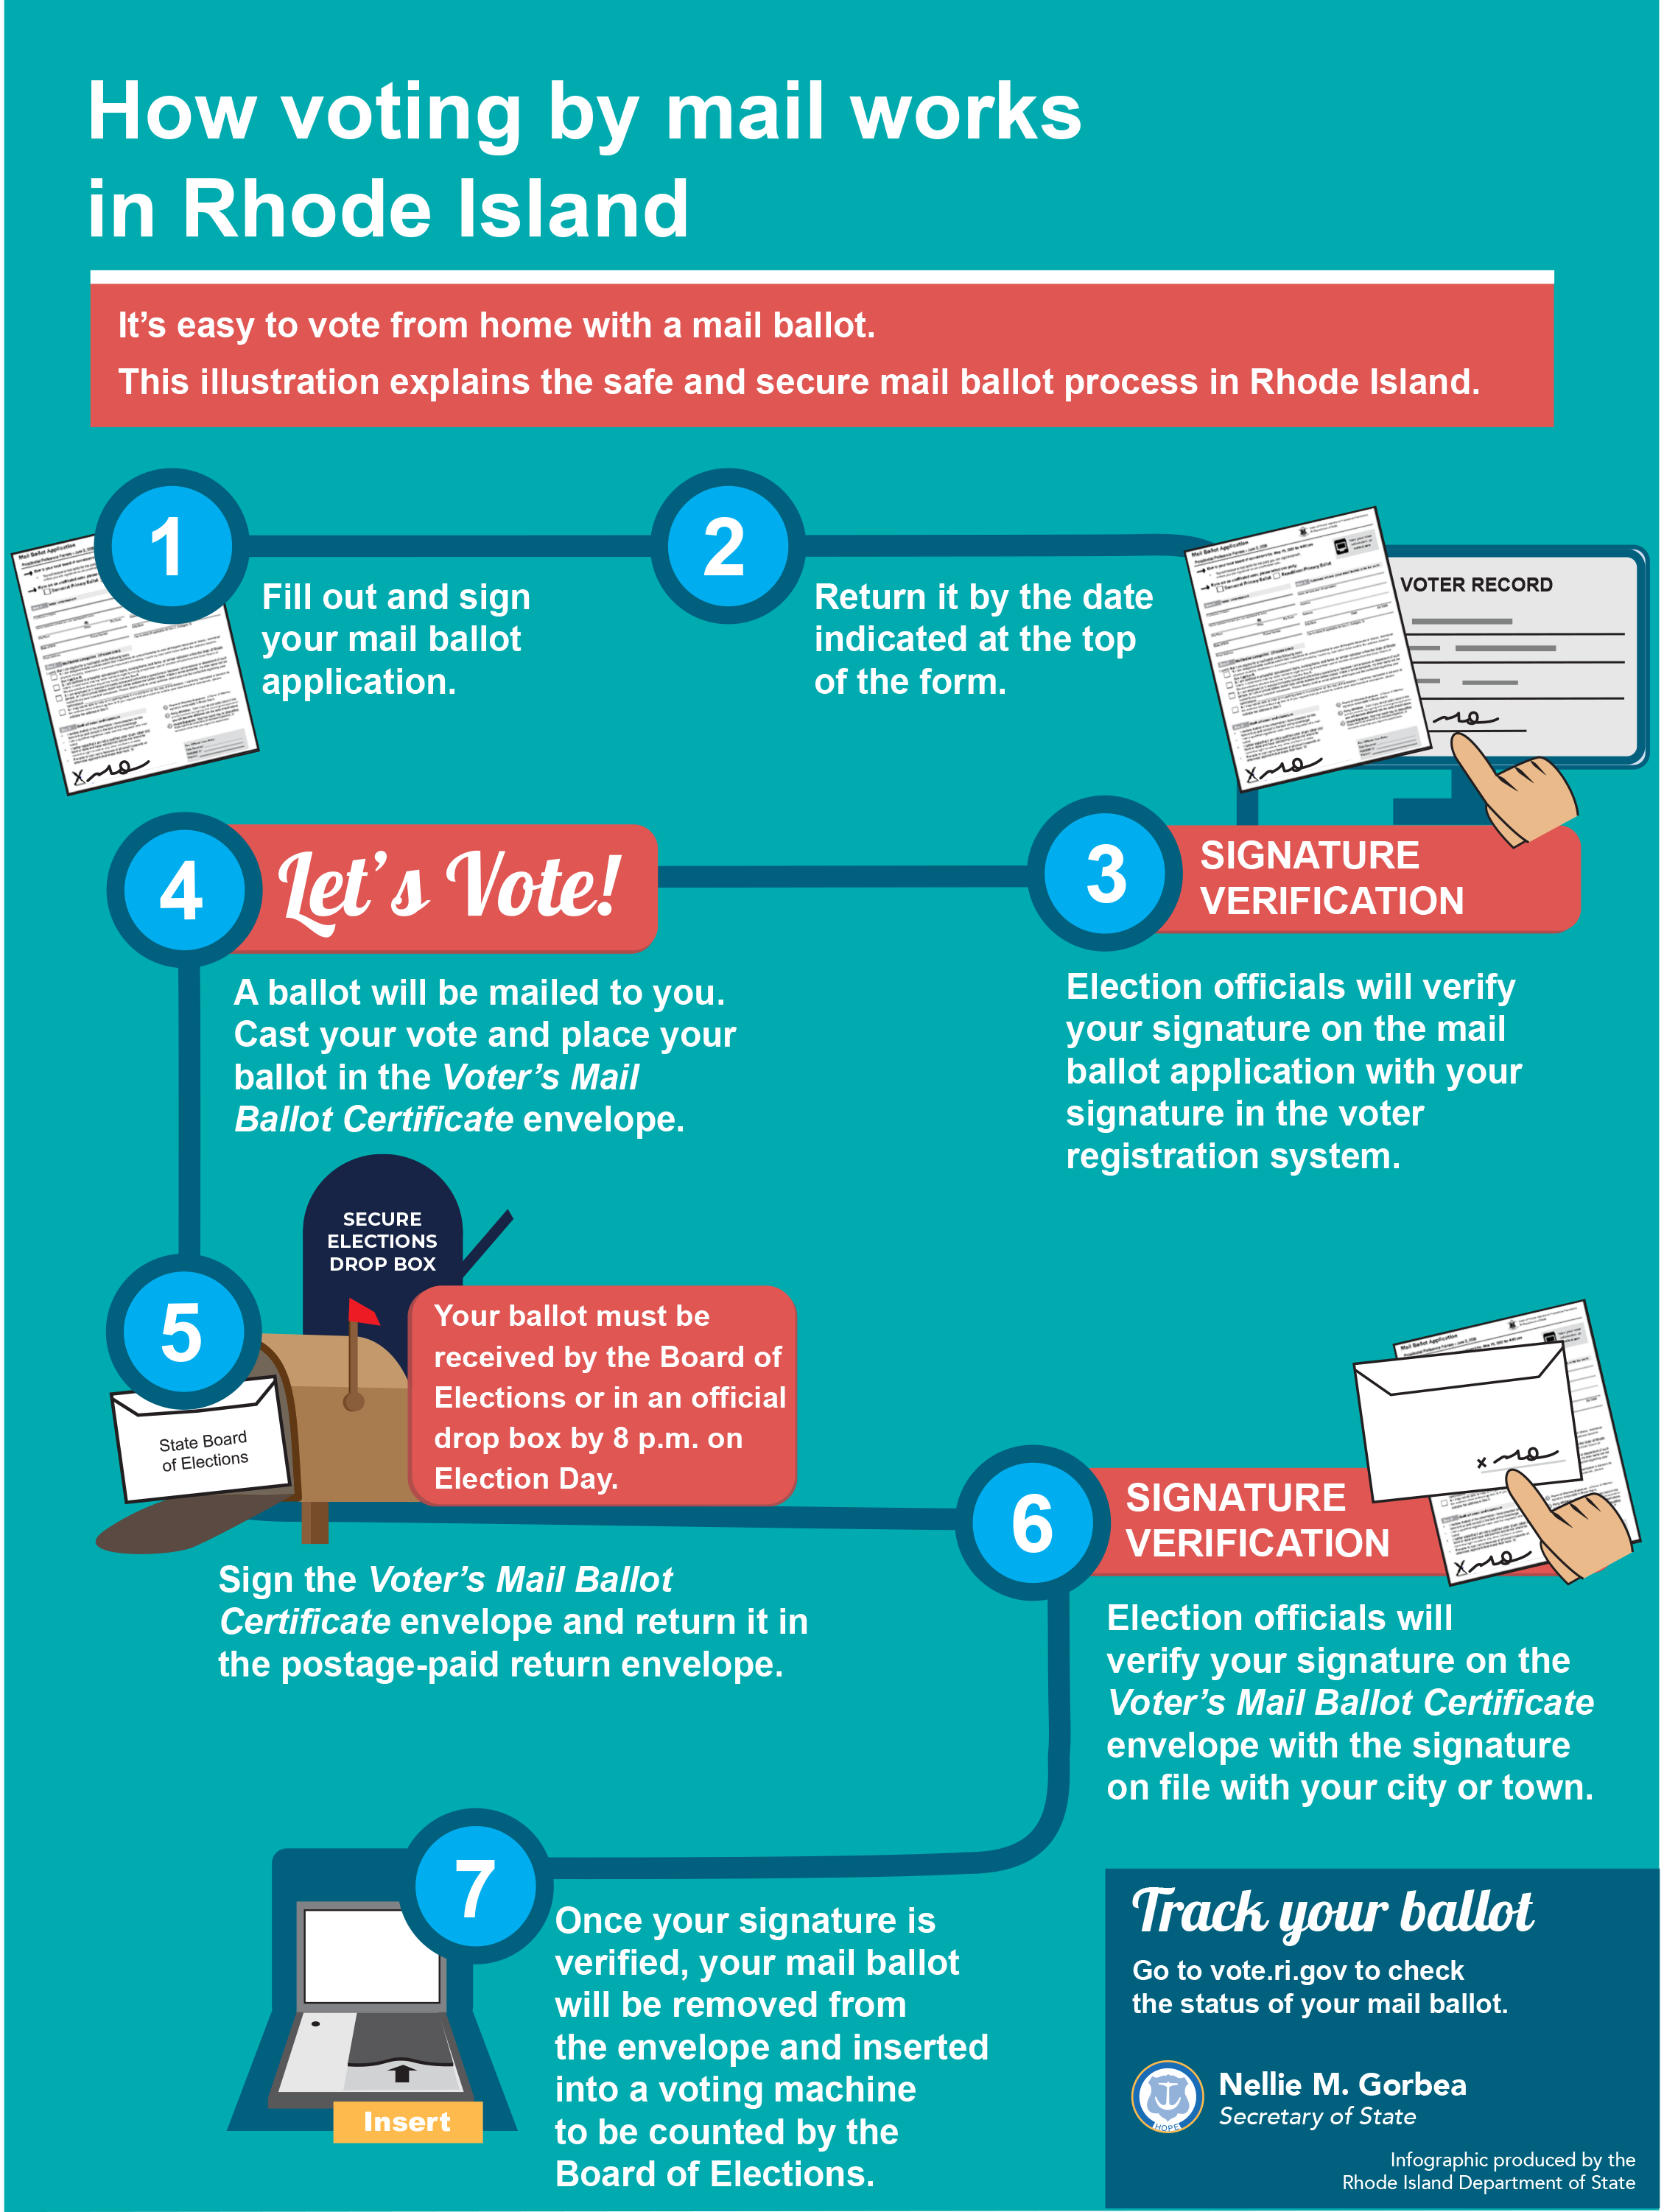
How to Vote by Mail in Rhode Island
With voters needing to vote by mail due to the pandemic, I developed this process infographic to illustrate the steps to voting by mail in Rhode Island. This infographic was featured in a national playbook of best practices for elections communications during COVID.
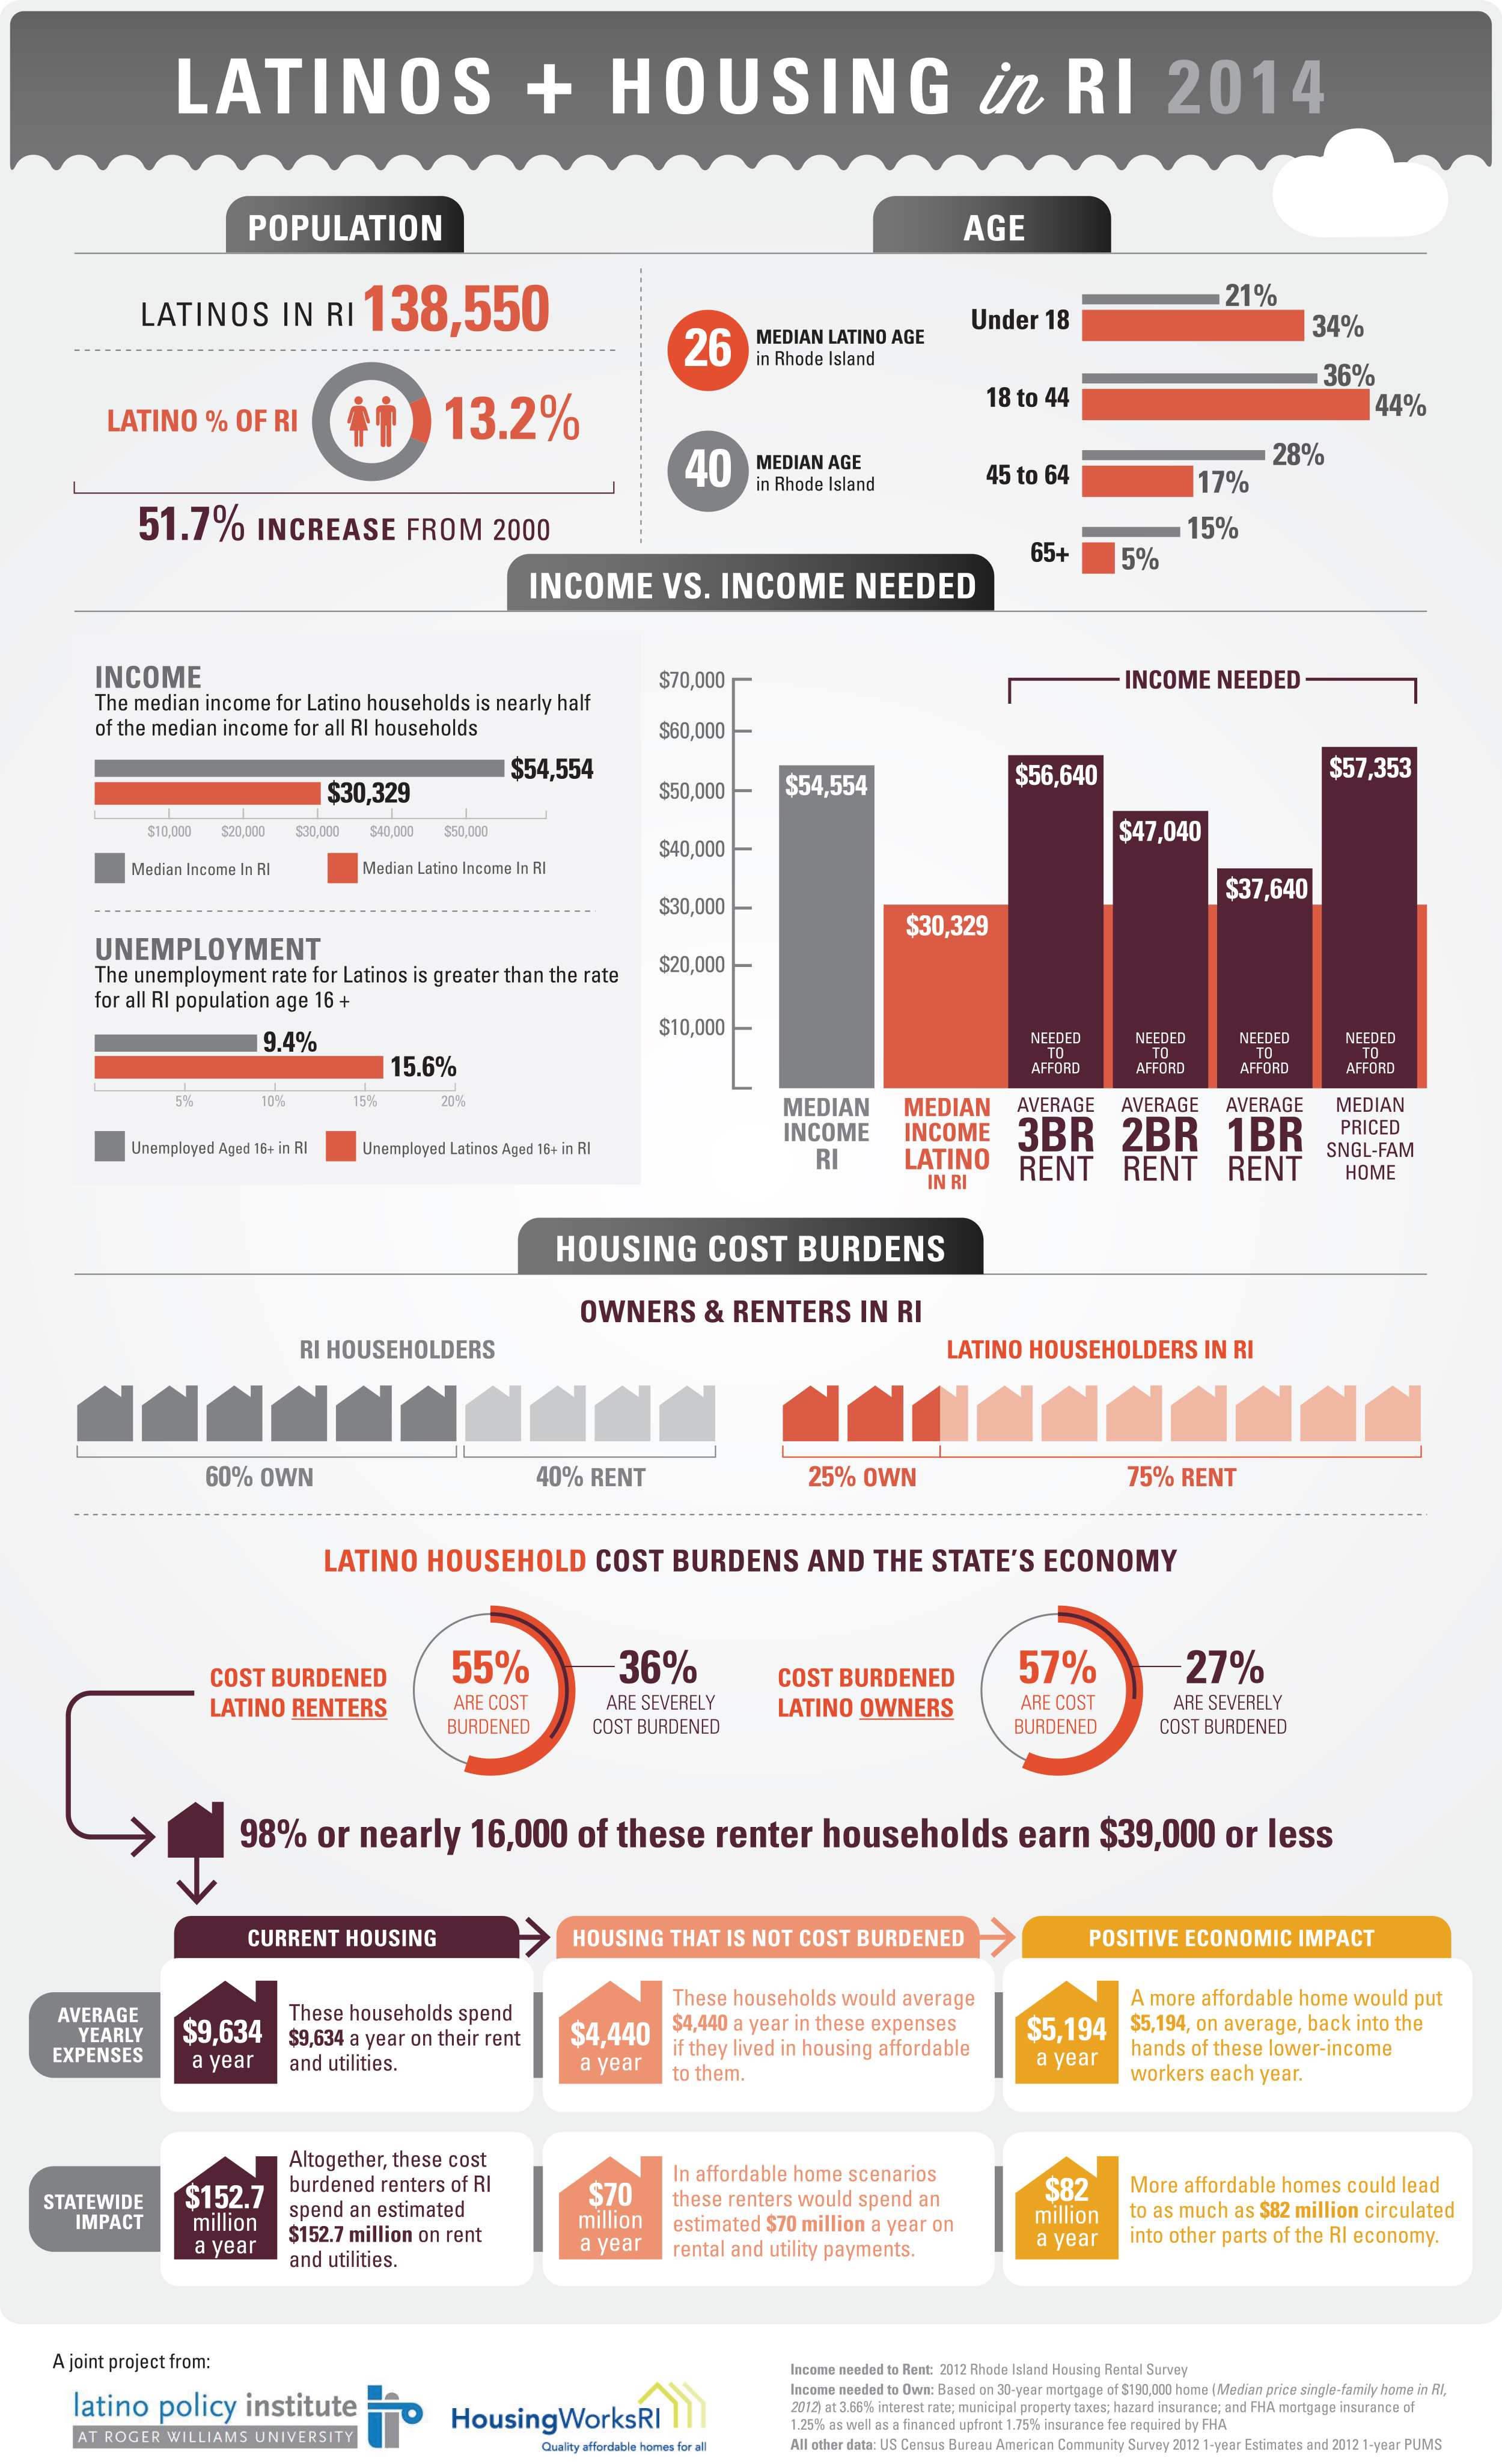
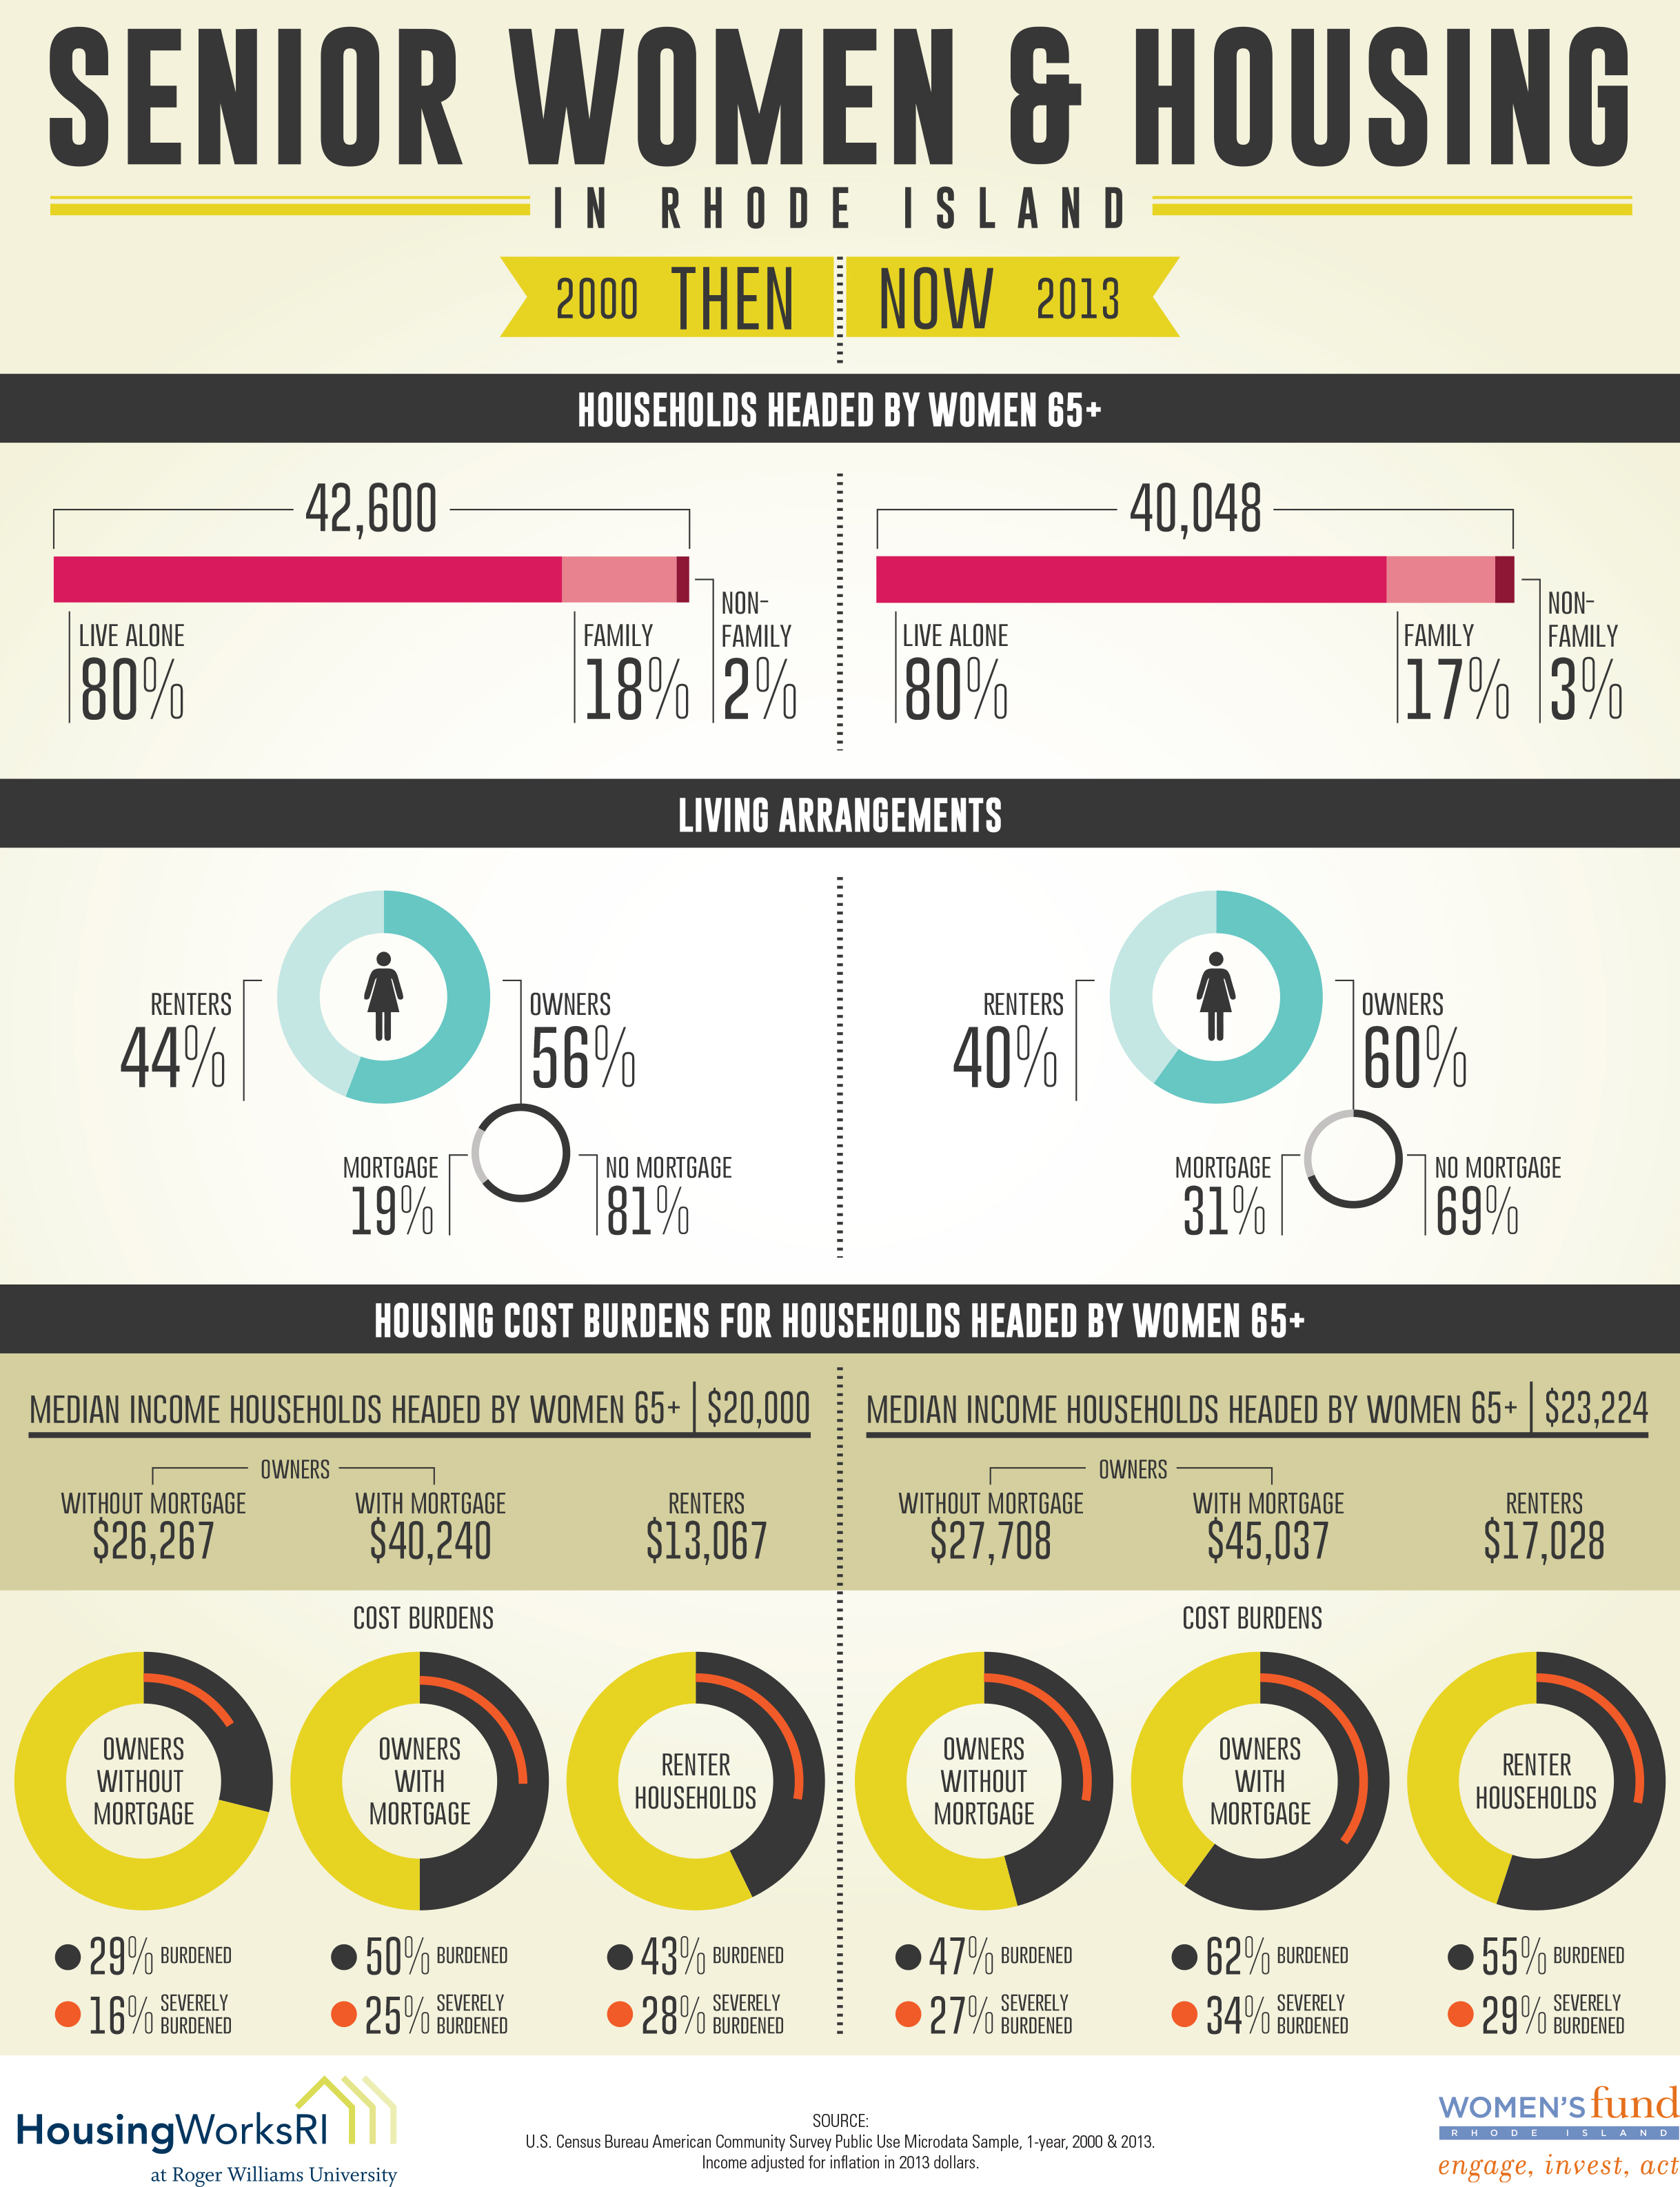
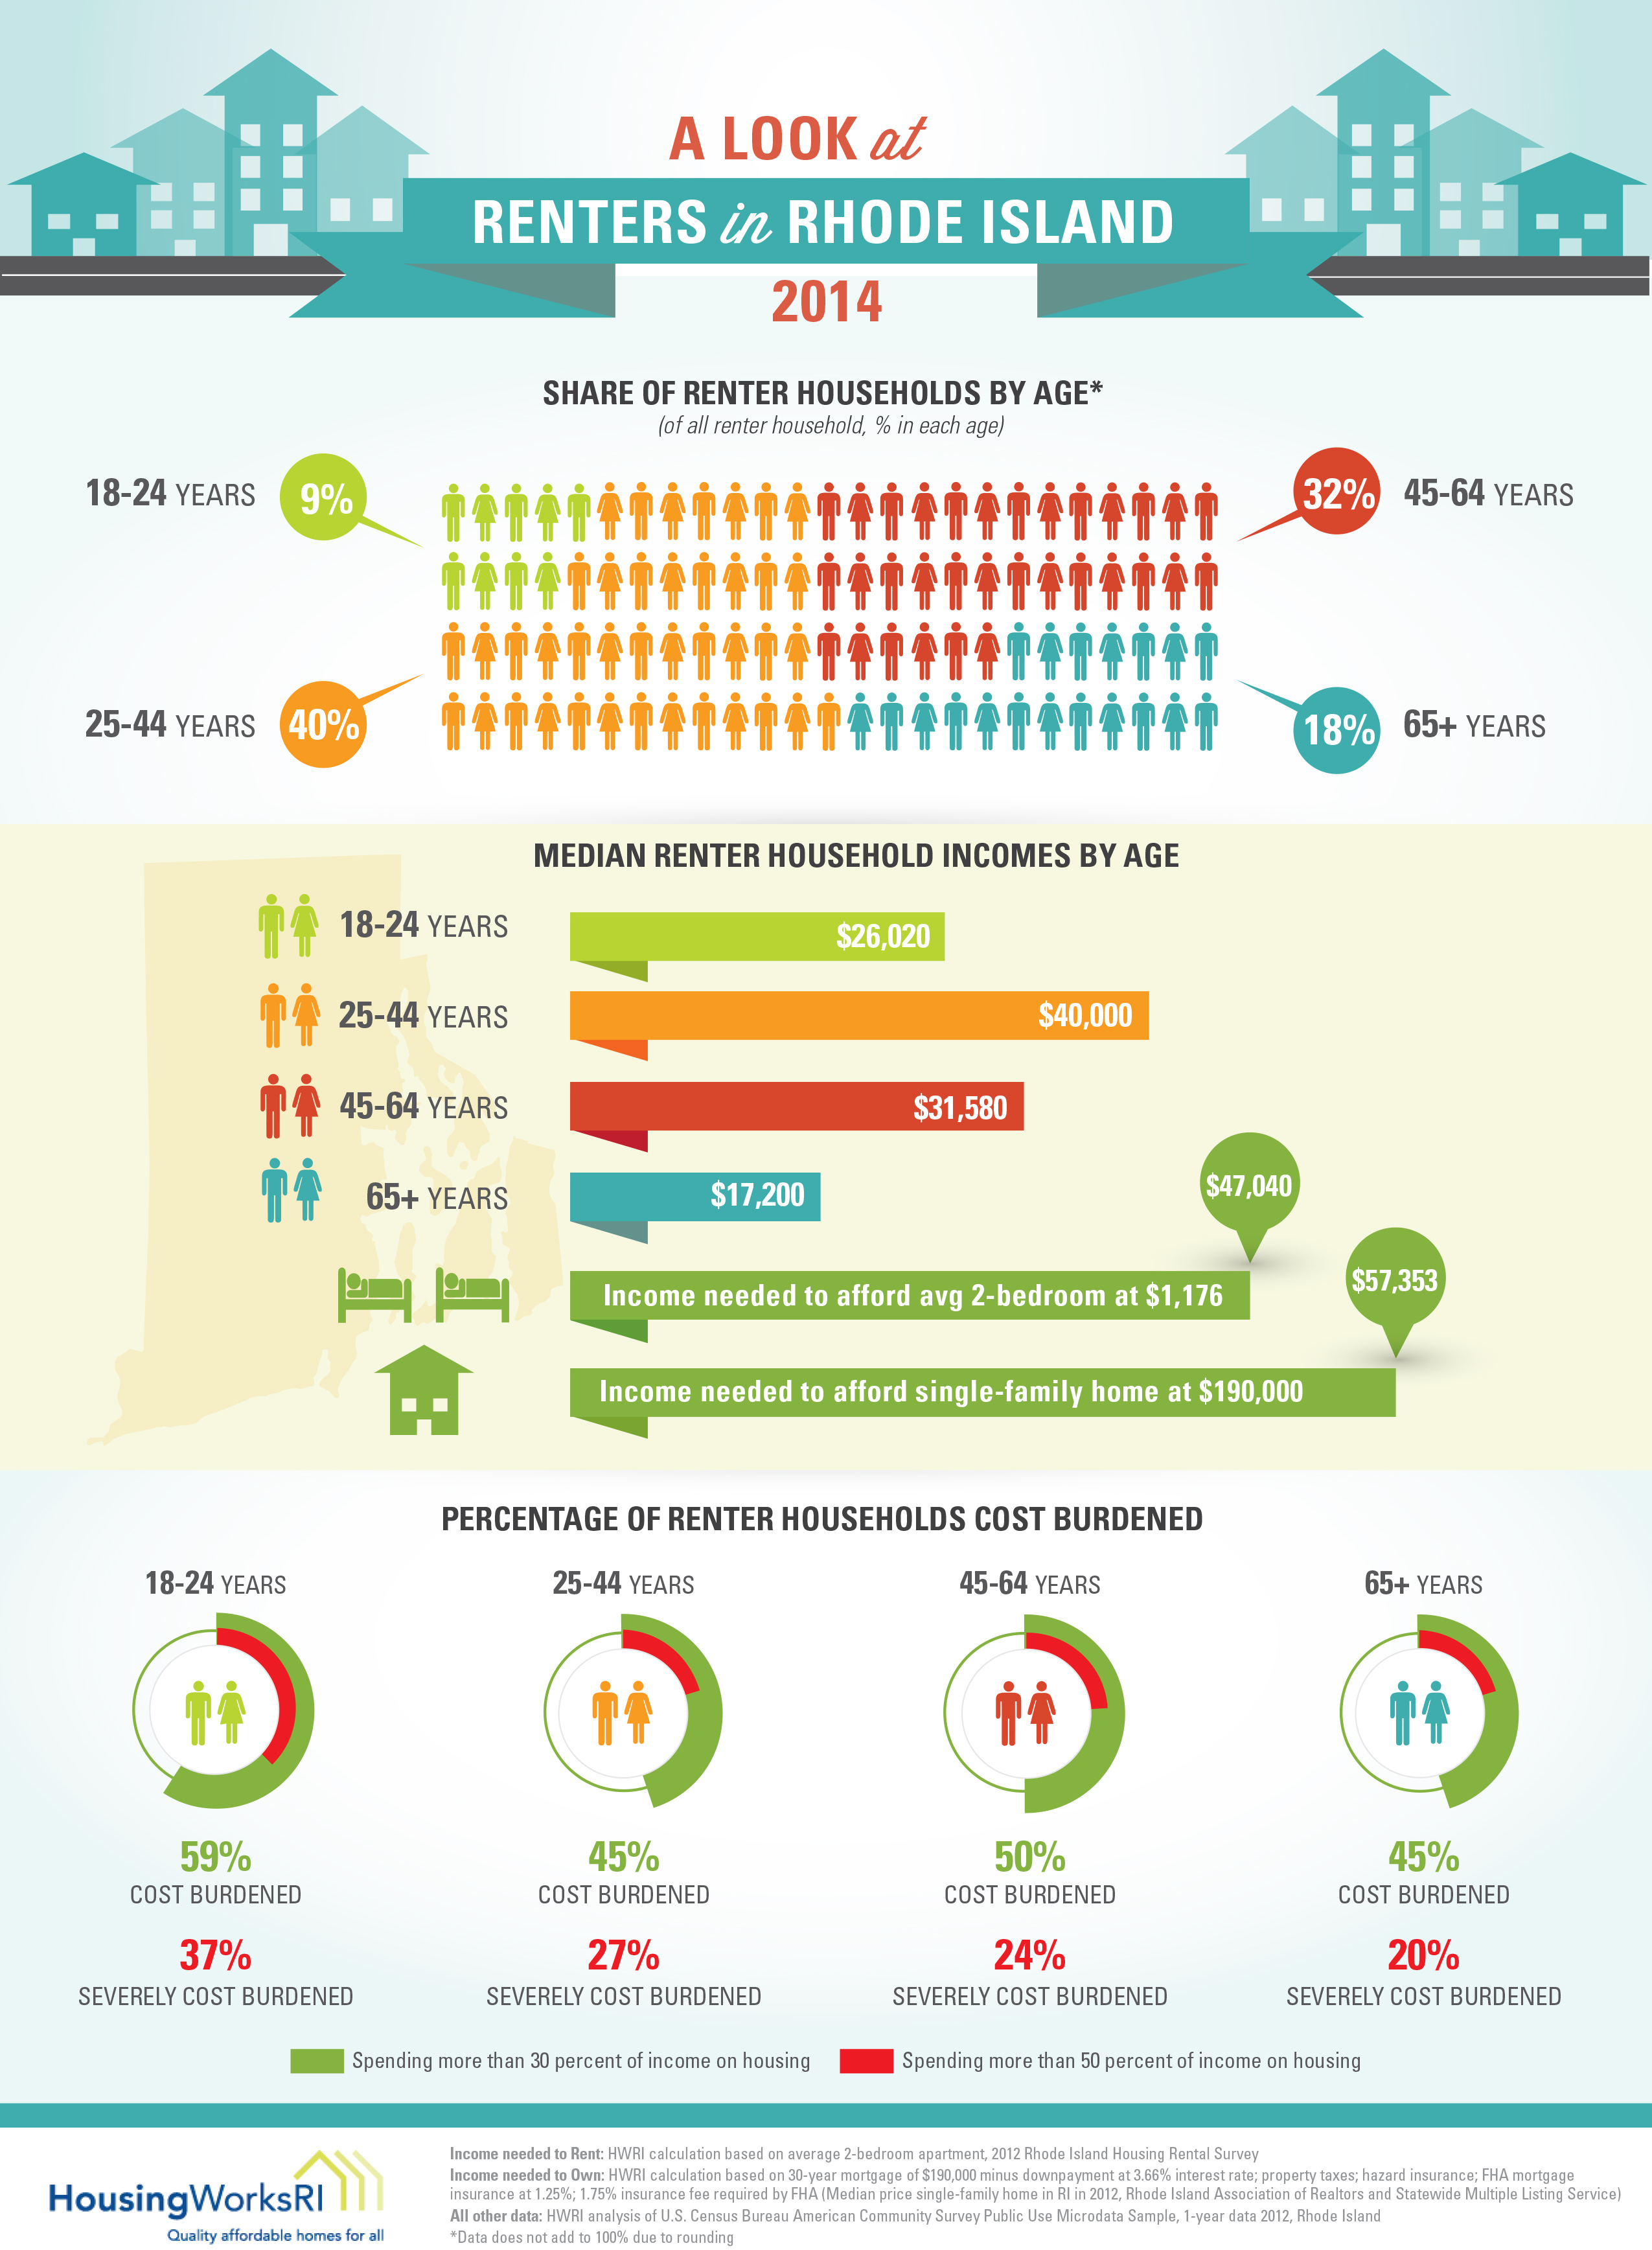
Additional Infographics
At HousingWorks RI, I worked with designers to simplify data analyses of housing affordability in Rhode Island.